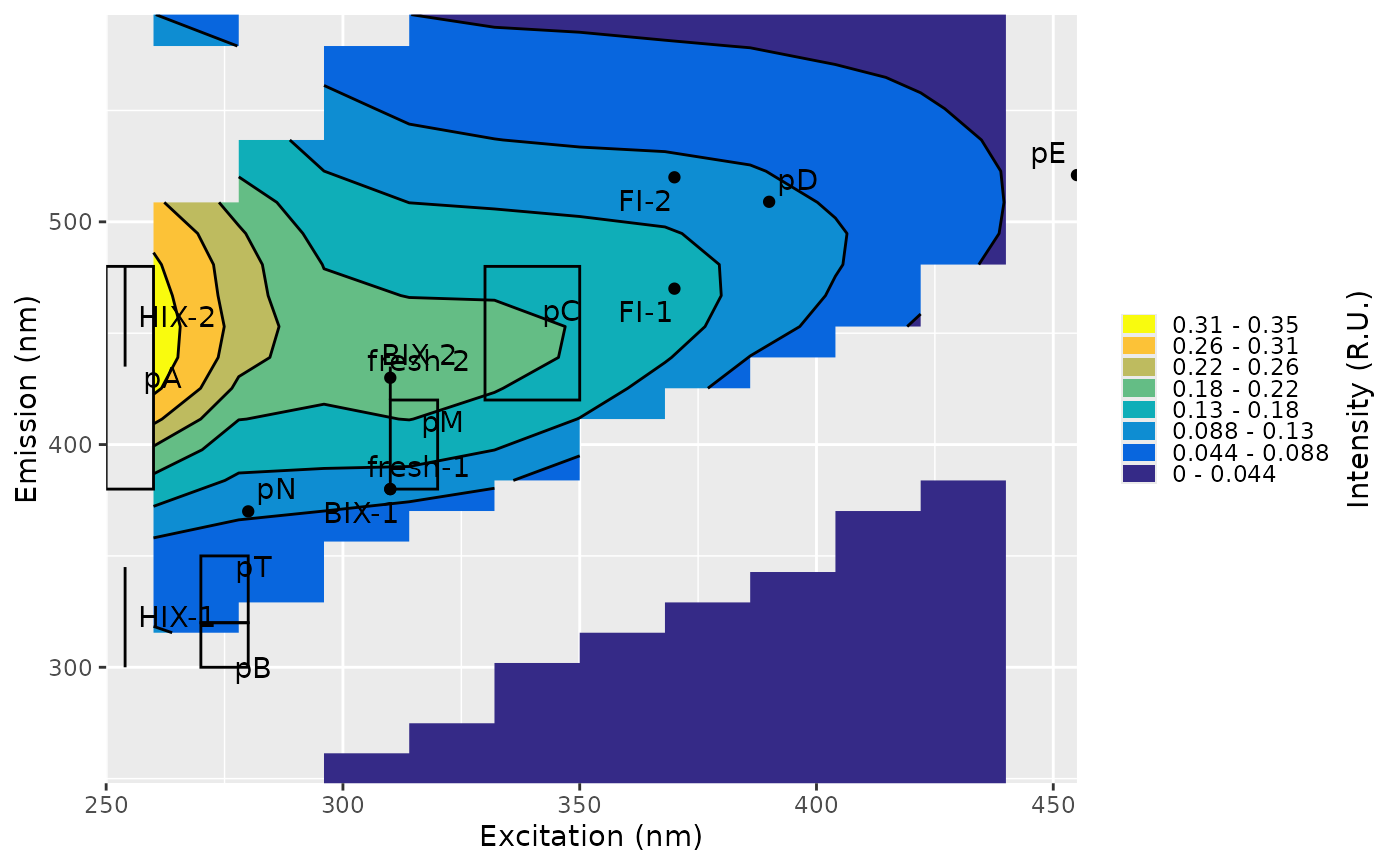
Adds labels indicating the regions of an excitation–emission matrix (EEM) that are used to calculate fluorescence indices. The annotation is customized according to the selected index method.
Examples
plot <- plot(example_processed_eems[[3]])
annotate_plot(plot)