Interpreting eemanalyzeR Outputs
Source:vignettes/output-documentation.Rmd
output-documentation.RmdExported Data
Every data export from eemanalyzeR using the
export_data() or run_eems() functions contains
the following files:
-
* .png: Plots of the individual EEMs
 Contour plot of a single EEM.
 -
absorbance_plot_filename.png: Plot showing the absorbance spectra
 Line plot of absorbance for each sample.
 -
summary_plots_filename.png: Plot showing all of the EEMs together
 Four contour plots for each EEM within the example dataset.
 -
*_indices_filename.csv:The absorbance and fluorescence indices
#> sample_name meta_name pB pT #> 1 B1S1ExampleBlankSEM ExampleBlank MDL01 MDL01 #> 2 B1S2ExampleTeaStdSEM ExampleTeaStd 0.5991 0.6624 #> 3 B1S3ExampleSampleSEM ExampleSample 0.08022 0.0836 #> 4 ManualExampleTeaWaterfallPlotSample ManualExampleTea 1.338_STD01 1.601_STD01 #> pA pM pC pD pE pN #> 1 DATA02_MDL01 MDL01 MDL01 MDL01 DATA01 MDL01 #> 2 0.2806_DATA02 0.1747 0.1453 0.01998 DATA01 0.2777 #> 3 0.3403_DATA02 0.1875 0.1969 0.09784 DATA01 0.0901 #> 4 0.7214_DATA02 0.3419_STD01 0.2801_STD01 0.03727_STD01 DATA01 0.6365_STD01 #> rAT rCA rCM rCT pB_DOCnorm pT_DOCnorm pA_DOCnorm #> 1 DATA01_DATA02 DATA01_DATA02 DATA01 DATA01 DOC01 DOC01 DOC01_DATA02 #> 2 0.4236_DATA02 0.518_DATA02 0.8321 0.2194 DOC01 DOC01 DOC01_DATA02 #> 3 4.071_DATA02 0.5786_DATA02 1.05 2.356 0.04135 0.04309 0.1754_DATA02 #> 4 0.4506_DATA02 0.3883_DATA02 0.8192 0.175 DOC01 DOC01 DOC01_DATA02 #> pM_DOCnorm pC_DOCnorm pD_DOCnorm pE_DOCnorm pN_DOCnorm FI HIX HIX_ohno #> 1 DOC01 DOC01 DOC01 DATA01 DOC01 MDL01 DATA01 DATA01 #> 2 DOC01 DOC01 DOC01 DATA01 DOC01 1.481 DATA01 DATA01 #> 3 0.09663 0.1015 0.05043 DATA01 0.04645 1.435 DATA01 DATA01 #> 4 DOC01 DOC01 DOC01 DATA01 DOC01 1.574 DATA01 DATA01 #> fresh BIX #> 1 MDL01 MDL01 #> 2 0.6044 0.6105 #> 3 0.5385 0.5466 #> 4 0.6591 0.6662 -
readme_filename.txt: A text file detailing the processing steps and any warnings that occurred during data processing
#> [1] "2026-04-15 15:34" #> [2] "Data processed using eemanalyzeR 1.1.0 package in R." #> [3] "For details on processing steps, indices, and QA/QC flags see the package website: https://katiewampler.github.io/eemanalyzeR/articles/output-documentation.html" #> [4] "______________________________" #> [5] "" #> [6] "2026-04-15 15:34:50: blanks were subtracted from data via 'subtract_blank' function" -
processed_data_filename.rds: An R readable object containing all of the exported data. Read in using
readRDS()function.#> Registered S3 method overwritten by 'eemanalyzeR': #> method from #> plot.eemlist eemR #> User configuration read from file: #> ~/.local/share/eemanalyzeR/user-config.yaml #> <list> #> ├─eemlist: S3<eemlist>... #> ├─abslist: S3<abslist>... #> ├─readme: <list>... #> ├─metadata: S3<data.frame>... #> ├─indices: <list>... #> ├─eem_plot: <list>... #> └─abs_plot: S3<ggplot2::ggplot/ggplot/ggplot2::gg/S7_object/gg>
QA/QC Checks
Visual Validation of Instrument Blank
The instrument blank can be plotted and visually validated by the user. This step is used to visually look for blank contamination or errant peaks that could impact data during blank subtraction.
If this step is performed the readme will contain a line that this visual check occurred and the user processing the data accepted the data.
The
validate_blanks()function also has the option that if the user does not accept the instrument blank, it may be replaced with one of the analytical blanks. In this case the readme will note the blank that was used instead of the instrument blank.
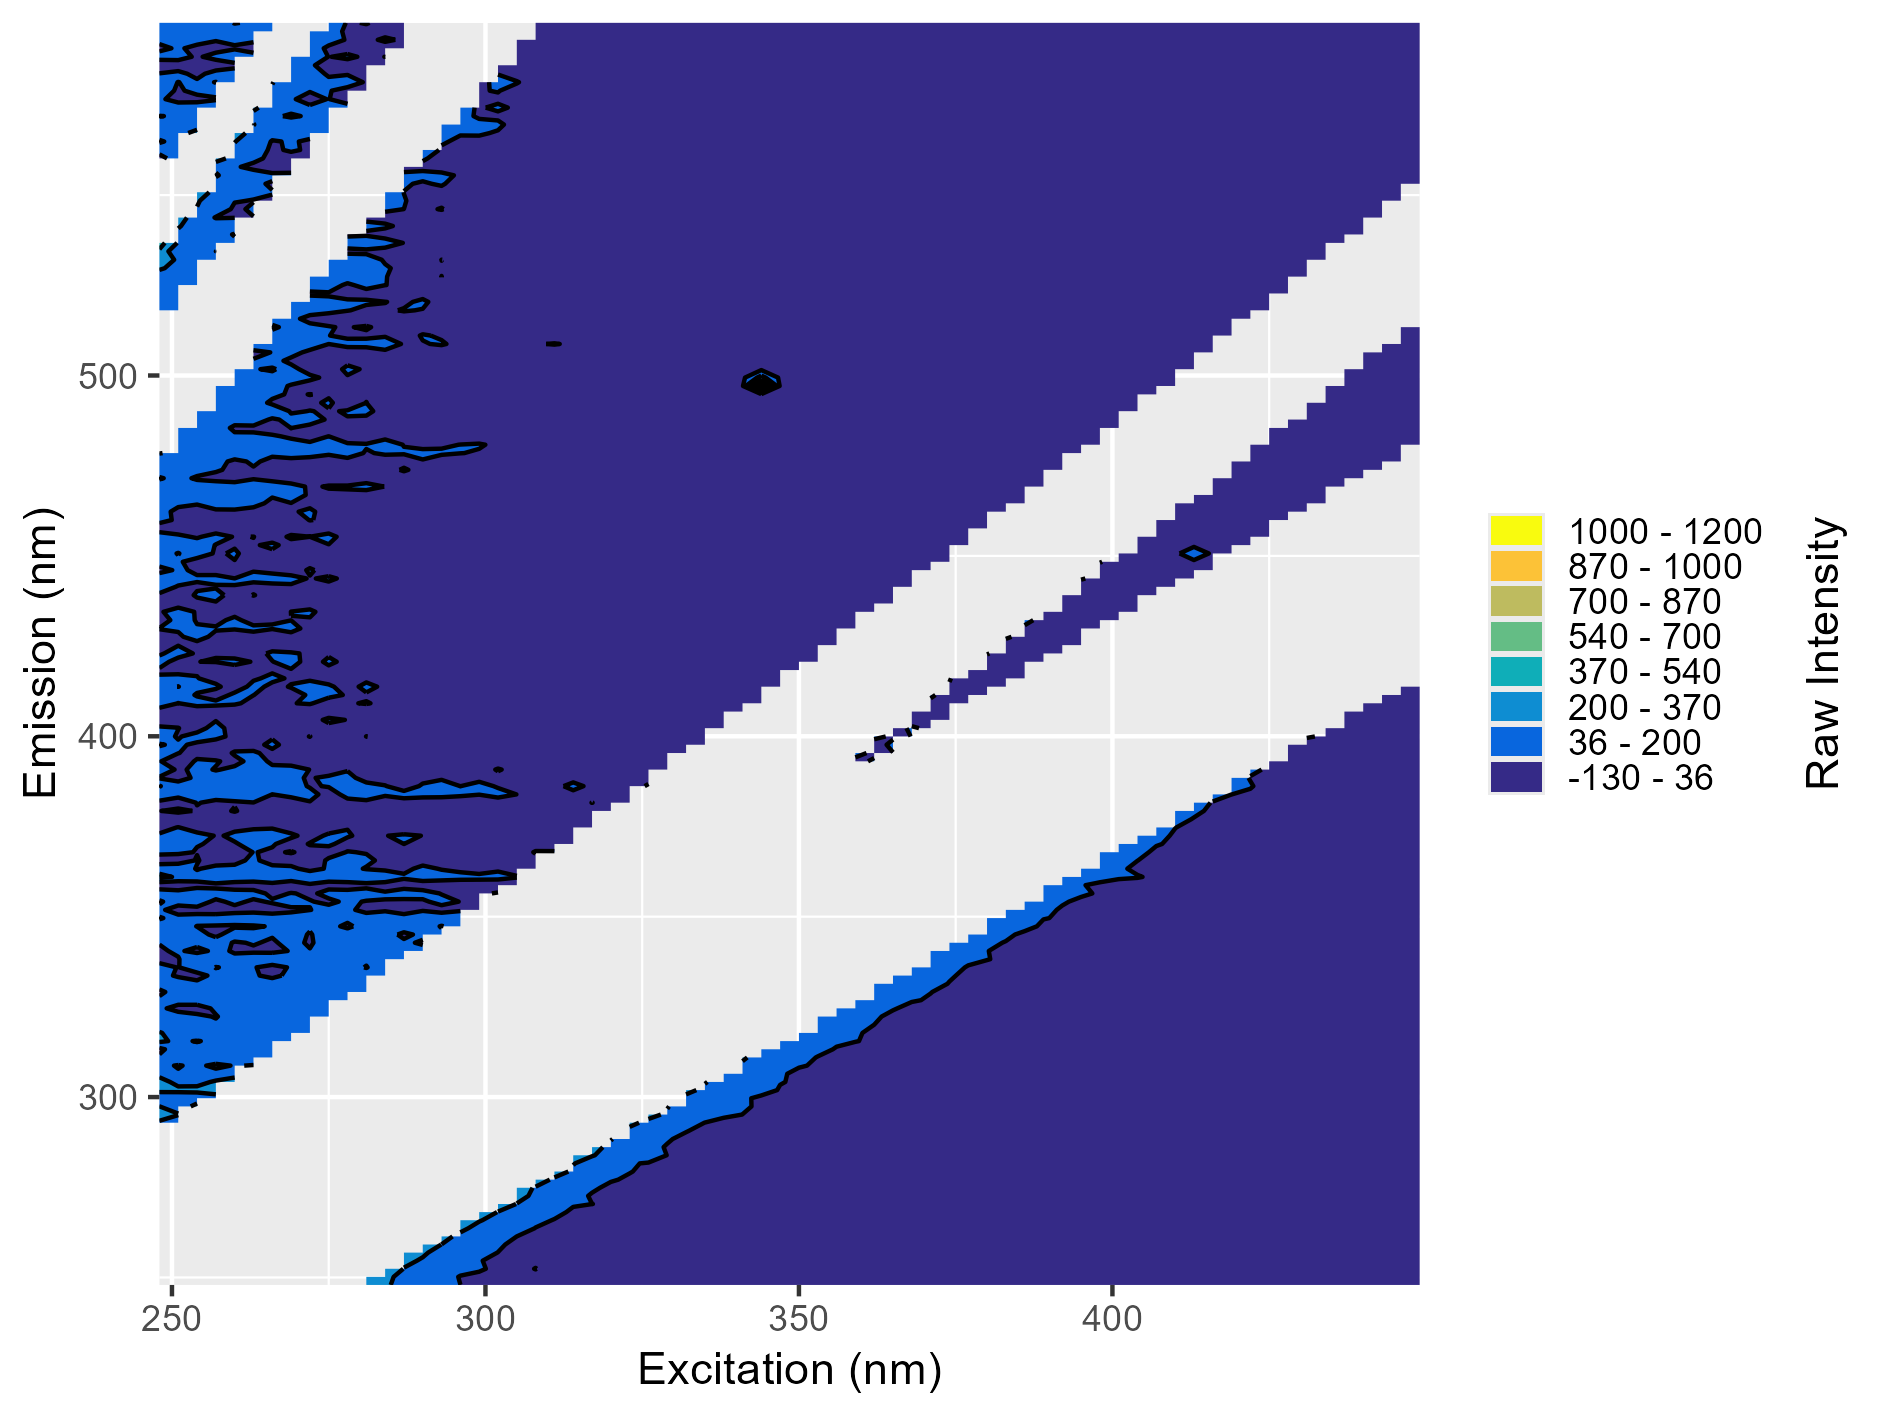
What a Blank Should NOT Look Like
Broad Blank Contamination
There’s a clear peak in the 300-400 nm emission range. This indicates likely contamination in the blank and it should not be used for blank subtraction.
Narrow Blank Contamination
Around excitation 350 nm and emission 500 nm, there’s black dot that sticks out. This is often caused by small particles in the sample causing small localized areas of high fluorescence. This blank should also not be used for blank subtraction.
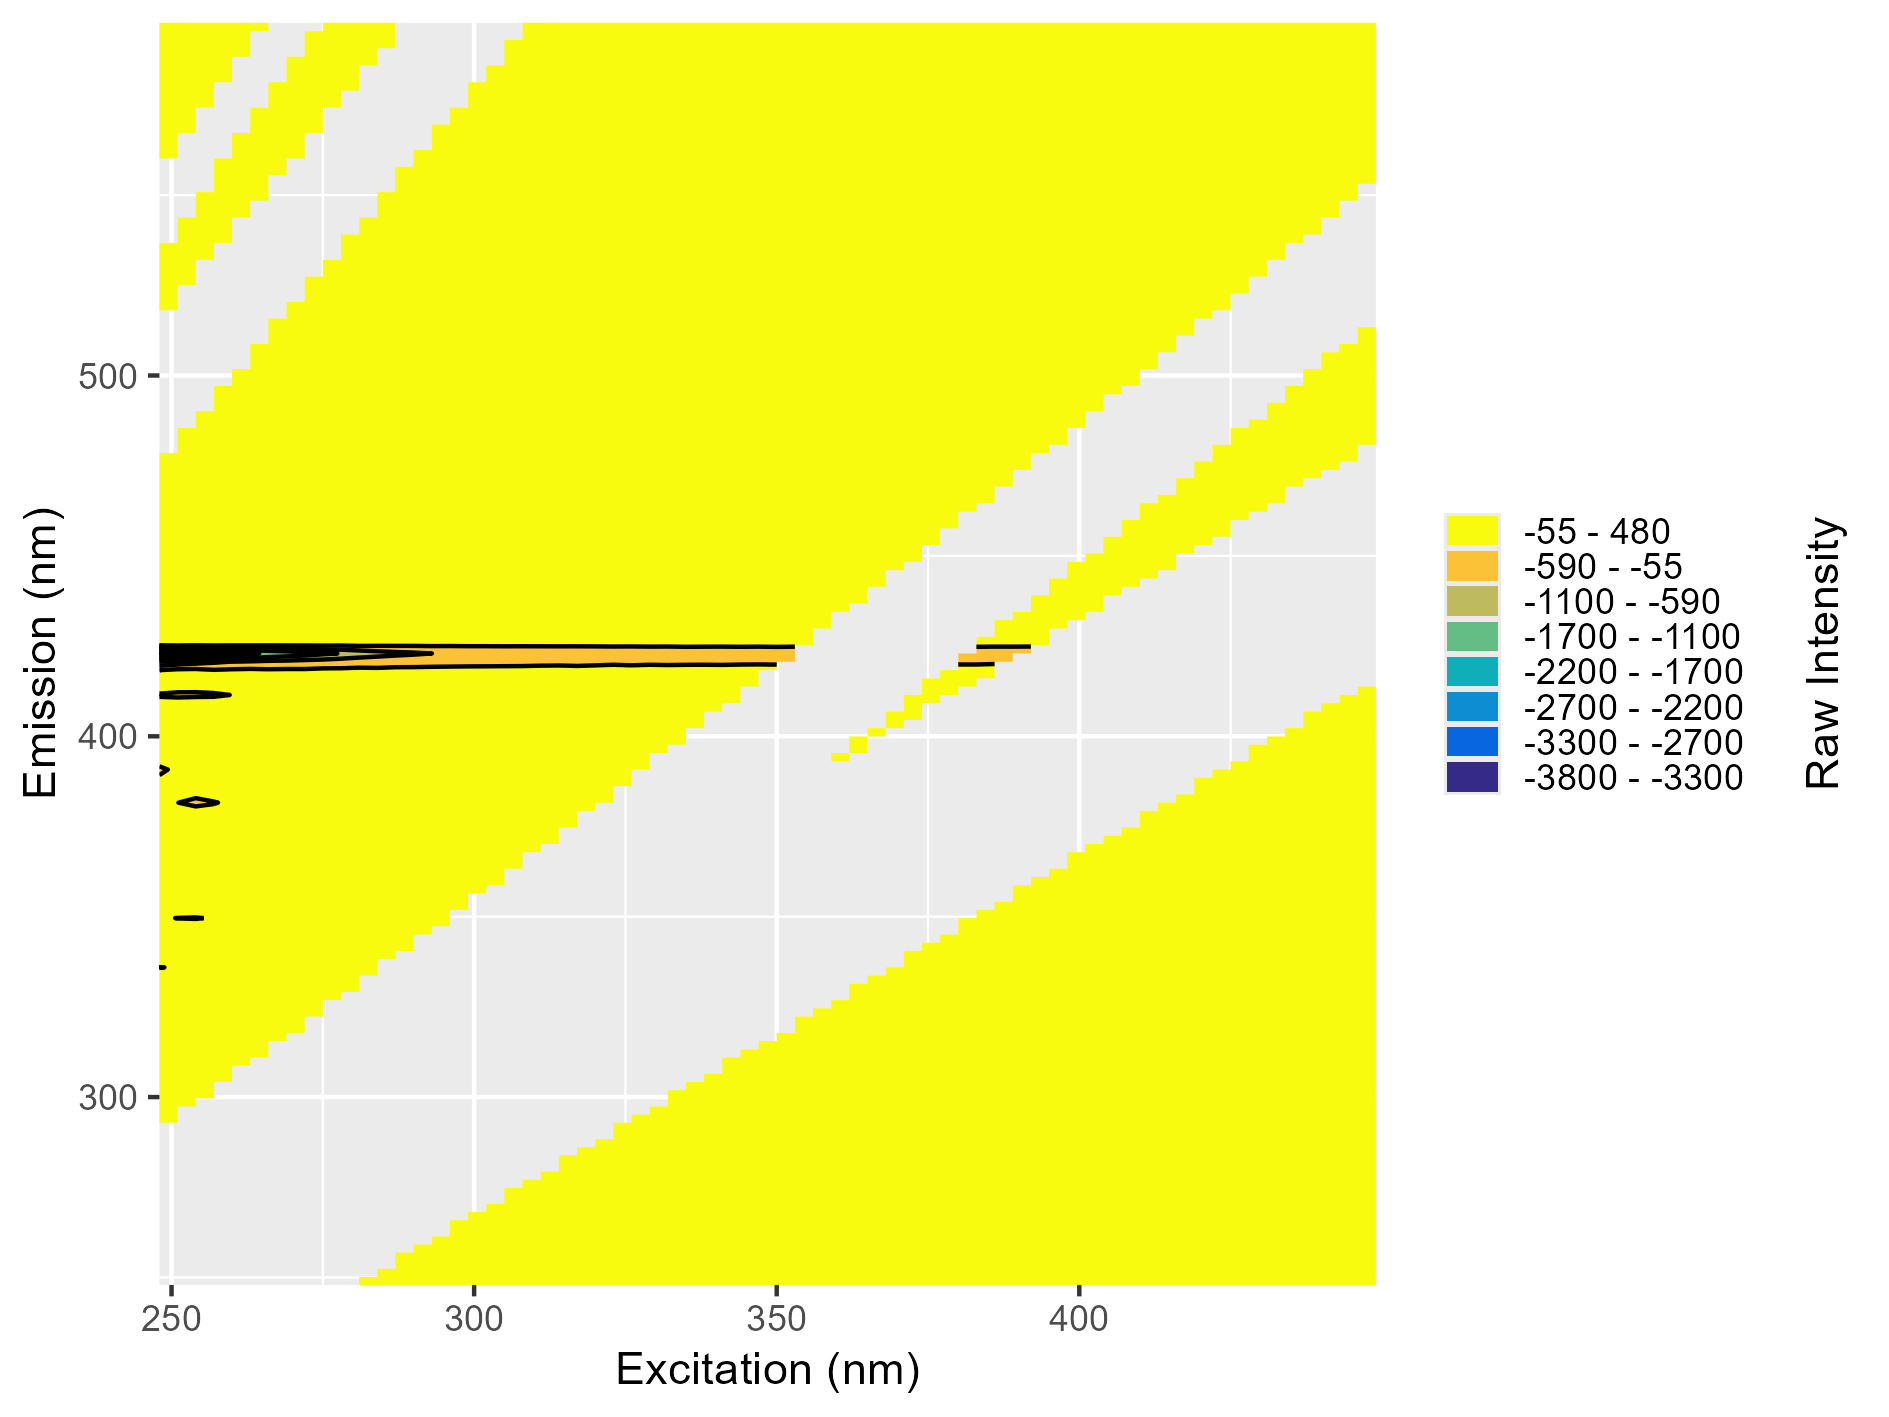
Weird Artifacts
Around emission 420 nm, there’s a long “peak” and the intensity is fully negative. Both these issues indicate likely problems with the instrument blank and it should not be used for blank subtraction.
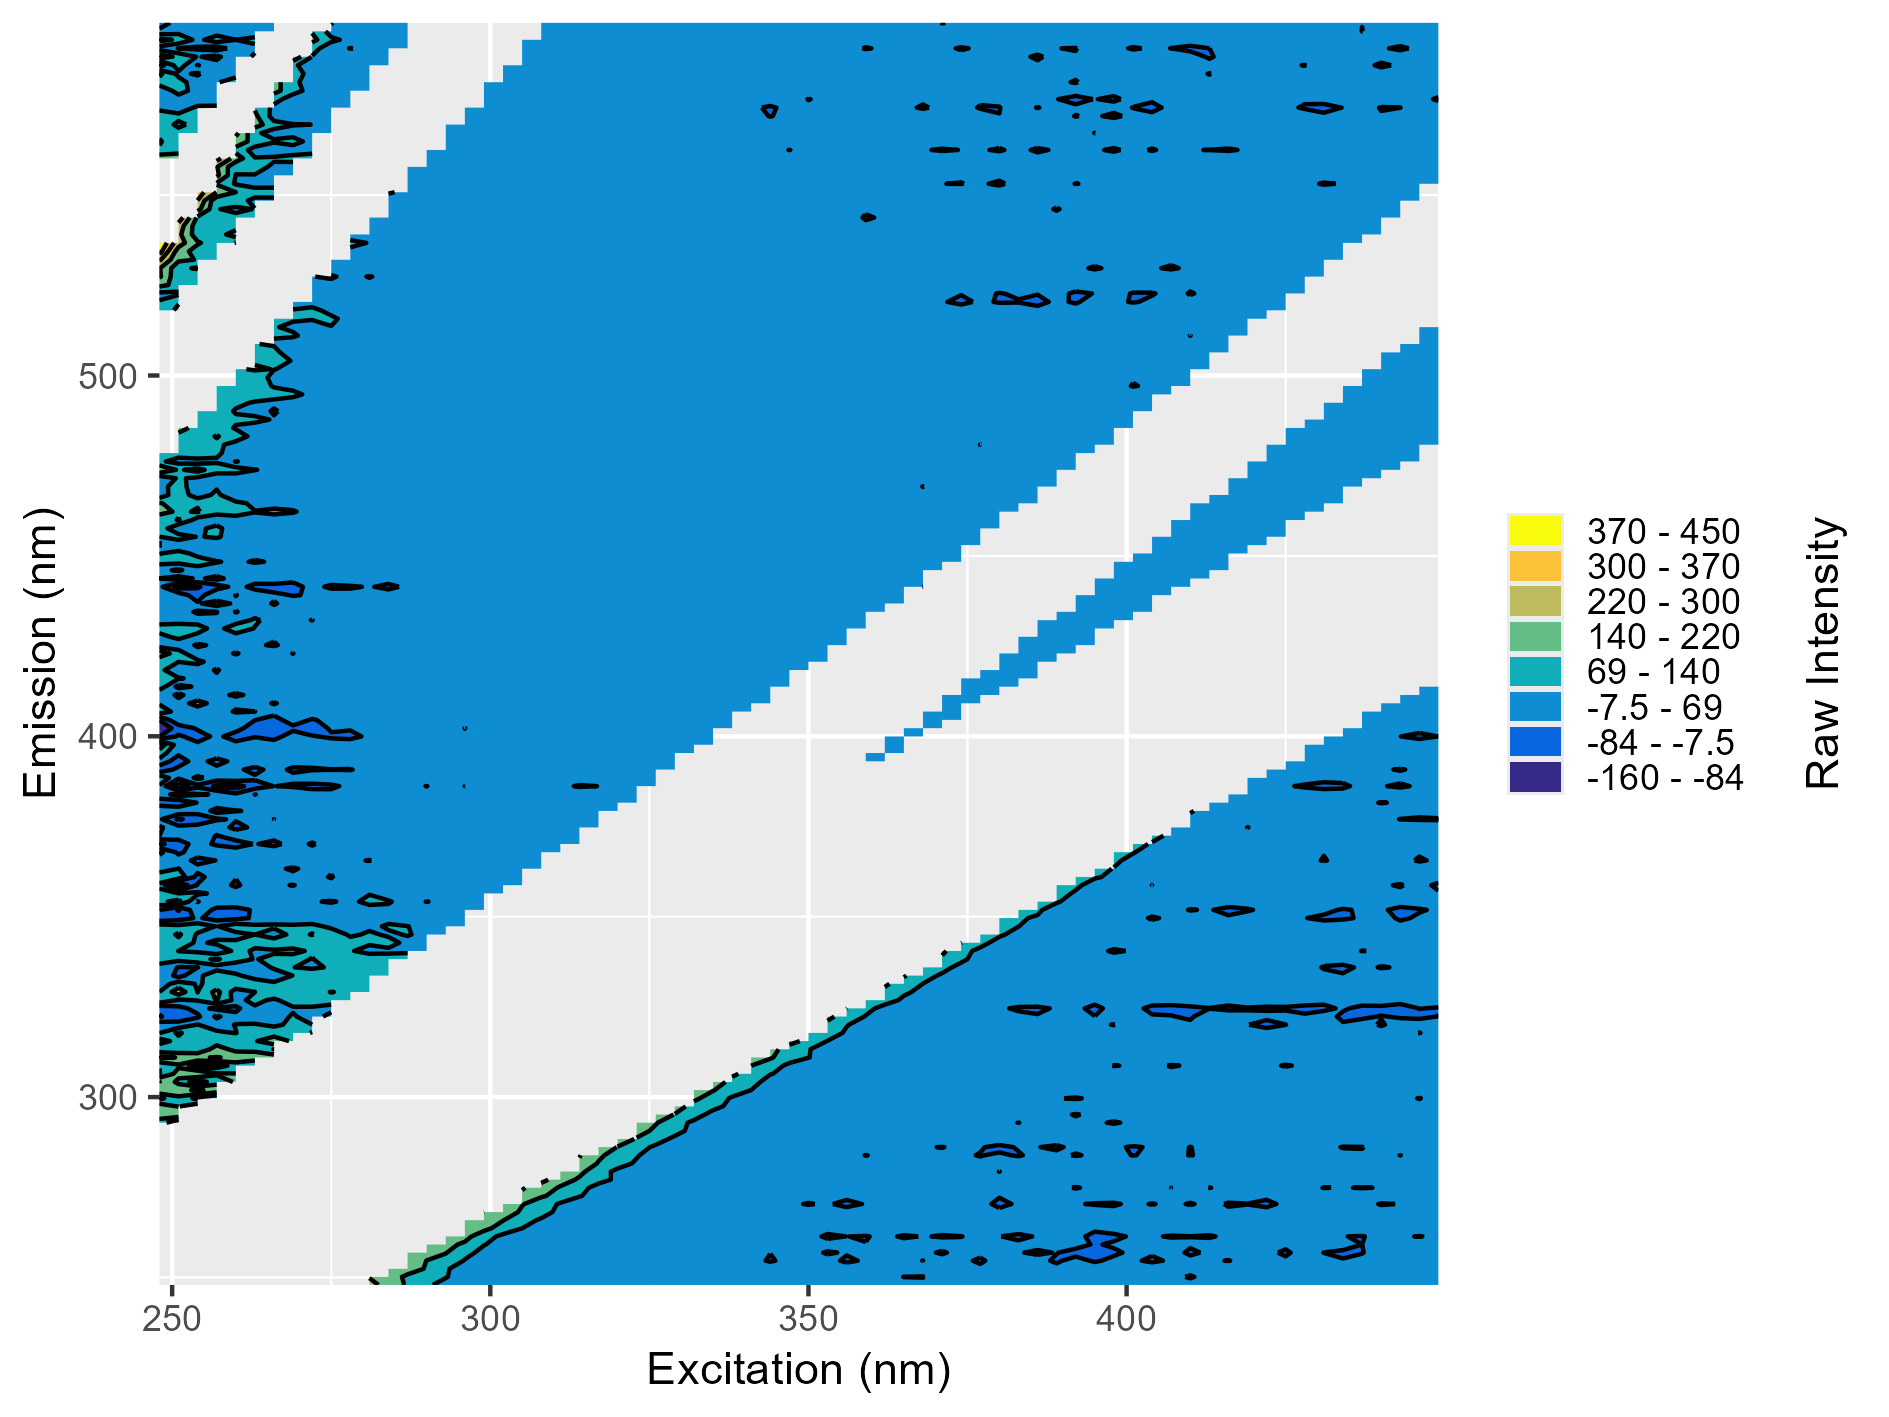
What a Blank Should Look Like
When you remove the scattering lines, the blank should look similar to the plot below. You’re likely to see some random peaks due to noise, but the noise shouldn’t resemble a peak. You might also see strong bars on the sides of the removed scattering regions. These are normal and just indicate that the scattering regions were perhaps wider than standard, but not cause to reject the blank.
Method Detection Limits
Absorbance and fluorescence indices can be compared to method detection limits (MDL). The MDL is the minimum signal at which we can confidently distinguish a measurement from zero and from analytical blanks. Here, the MDL is calculated using the approach proposed by Hansen et al. (2018):
where long-term blank is the fluorescence for a specific wavelength pair or absorbance at a specific wavelength, mean is the average signal, and SD is the standard deviation.
To use the MDL checks, the user must create MDL files for both
absorbance and fluorescence data using the create_mdl()
function. If no MDL files are found, a warning will appear in the
readme file.
Check Standards
Samples of sample type check can also be checked against
a long-term average for consistency.
To use the check standard checks, the user must create average
standard files for both absorbance and fluorescence data using the
create_std() function.
If no standard files are found: a warning will appear in the readme file.
If a standard file exists: all available index values will be compared between the check standards within the run and the long term standard. If the value is outside the tolerance range (default is 20%), it will be flagged in the index file. Additionally the readme file will contain a summary of the number of indices outside the tolerance range across the entire run and the tolerance used.
Index QA/QC Flags
Flags are used to indicate missing or potentially problematic
indices. If the the issue is such that there’s no value to report, only
the flag will be returned (i.e., DOC01). If there’s a value
to report, but it should be used with knowledge there may be an issue
with the value, the flag will append the value (i.e.,
0.412_VAL01) if the indices are in “wide” format (the
default) or in a QAQC_flag column in a “long” format. See
get-indices() for more details.
The following flags may appear in the indices output files:
- DATA01: Missing data required for calculation
- DATA02: Missing required wavelengths; value may be inaccurate
- DATA03: Ratio denominator was zero
- DATA04: Spectral slope could not be calculated
- DOC01: Missing dissolved organic carbon (DOC) data
- INF01: Infinite value
- MDL01: All values below MDL
- MDL02: One or more values below MDL; use cautiously
- MDL03: Ratio index where numerator or denominator was entirely below MDL
- NEG01: Negative value
- STD01: Check standard value outside tolerance
- VAL01: Value below typical range
- VAL02: Value above typical range
Indices
The absorbance indices reported by the default index method
(eemanalyzeR) and their typical
interpretations are:
| Index Name | Index Abbreviation | Interpretation |
|---|---|---|
| SUVA 254 | SUVA254 | proxy for aromaticity |
| SUVA 280 | SUVA280 | proxy for aromaticity |
| SVA 412 | SVA412 | proxy for aromaticity |
| Spectral Slope (275-295) | S275_295 | related to molecular weight and aromaticity |
| Spectral Slope (350-400) | S350_400 | related to molecular weight and aromaticity |
| Spectral Slope Ratio | SR | related to molecular weight |
| E2/E3 | E2_E3 | related to molecular weight and aromaticity |
| E4/E6 | E4_E6 | related to humic-like organic matter |
The fluorescence indices reported by the default index method
(eemanalyzeR) and their typical
interpretations are:
| Index Name | Index Abbreviation | Interpretation |
|---|---|---|
| Peak B | pB | tyrosine-like, protein-like organic matter |
| Peak T | pT | tryptophan-like, protein-like organic matter |
| Peak A | pA | UV humic-like organic matter |
| Peak M | pM | marine humic-like organic matter |
| Peak C | pC | visible humic-like organic matter |
| Peak D | pD | soil fulvic acid-like organic matter |
| Peak E | pE | soil fulvic acid-like organic matter |
| Peak N | pN | related to phytoplankton productivity |
| Ratio of Peak A to Peak T | rAT | ratio of humic-like to fresh organic matter |
| Ratio of Peak C to Peak A | rCA | ratio of humic-like to fulvic-like organic matter |
| Ratio of Peak C to Peak M | rCM | amount of blueshifted organic matter |
| Ratio of Peak C to Peak T | rCT | related to biochemical oxygen demand |
| Fluorescence Index | FI | terrestrial versus microbial sources |
| Humification Index-Zsolnay | HIX | indication of humic substances |
| Humification Index-Ohno | HIX_ohno | indication of humic substances |
| Freshness Index | fresh | indication of recently produced organic matter |
| Biological Index | BIX | indicator of autotrophic activity |
For more details on interpretation and sources see the vignette eemanalyzeR-indices.
References
Hansen, A. M., Fleck, J., Kraus, T. E. C., Downing, B. D., von Dessonneck, T., & Bergamaschi, B. (2018). Procedures for using the Horiba Scientific Aqualog® fluorometer to measure absorbance and fluorescence from dissolved organic matter (USGS Numbered Series No. 2018-1096). U.S. Geological Survey. https://doi.org/10.3133/ofr20181096