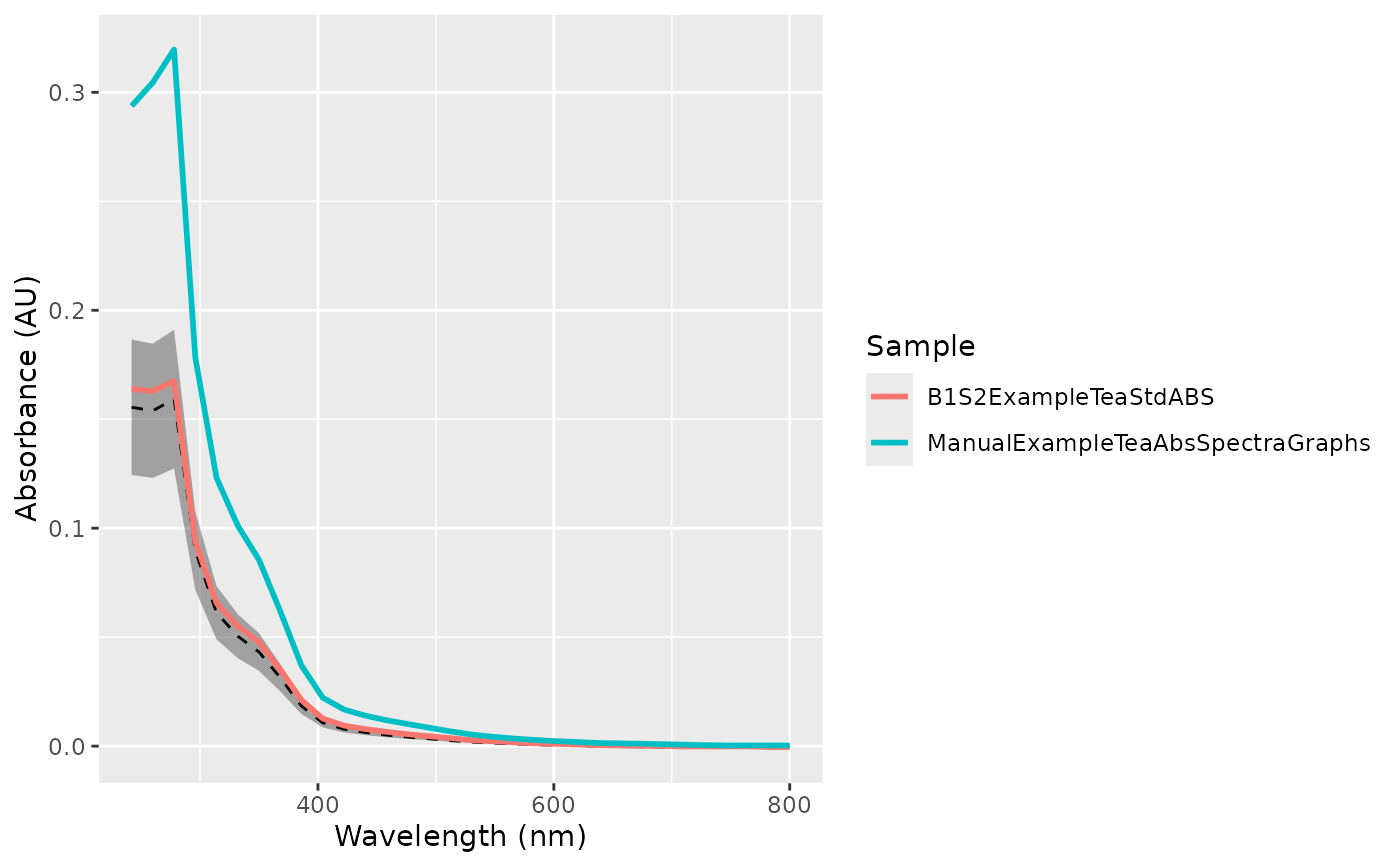
Visually inspect plots of the tea check standard absorbance compared to the long-term standard.
Arguments
- abslist
An
abslistobject.- qaqc_dir
File path to the QAQC files generated with
create_mdl()andcreate_std(). Default is a user-specific data directoryrappdirs::user_data_dir().- tolerance
Maximum percent deviation that the check standard can vary from the long-term values without being flagged.
Value
A ggplot object showing the absorbance of the check standards,
the long-term standard (dashed line), and the tolerance thresholds (gray ribbon).
Examples
abslist <- add_metadata(metadata, example_abs)
validate_std(abslist, system.file("extdata", package = "eemanalyzeR"))